Serend-IP, a spin-off from Münster University, offers nanoscale quantification services for cell surfaces using state-of-the art analytical techniques (AFM, nanomechnical mapping, electrical cell impedance spectroscopy, TIRF- and 4 pi-fluorescence imaging etc.). Combined with the knowledge about good epithelial and endothelial cell models, physiologically relevant in-vitro testing methods are conducted (Cellular (trans-)migration Assays, nano-toxicity assays etc.). Key competence of Serend-ip is the computer vision algorithms for the nAnostic™-method - the first solution for automatic mapping of biological AFM-images. This method exceeding optical resolution limits is patented (WO 2010: PCT/EP2010/057458). A label-free quantification of surface structures is possible down to the level of attoliters (10-18l). Since the establishment of a software tool (2011), various validation studies were started in different biological contexts. These are performed in close collaboration with scientific partners from universities and clinics across Europe, partially within national and international projects (BMBF/EU).
The company was founded in 2009 and is a four person start-up now. Dr. Riethmueller‘s research is in the field of cellular mechanics of inflammation with a focus on endothelial cell layers and barrier function. The team is comprised of Dr. Christoph Riethmüller (scientific head, supervisor), Dr. Armin Kramer (Application Scientist), Jonas Franz (Application Specialist) and Svetlana Izmailova (Administration).
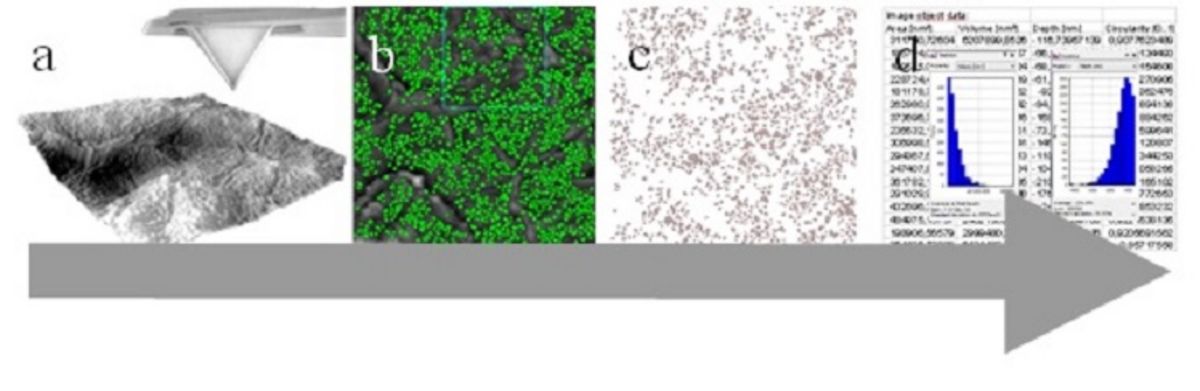
Figure 1: nAnostic-procedure a) the nanoscale topography of the cell sample is recorded via atomic force microscopy (AFM). b) Computer vision segments relevant objects (green) from background, c) Object map for morphometry and d) detailed number values are extracted, here only object count and local volume sum are displayed as histograms. For diagnosis, 10 arbitrarily chosen areas per sample are analysed and morphometrical data are averaged.
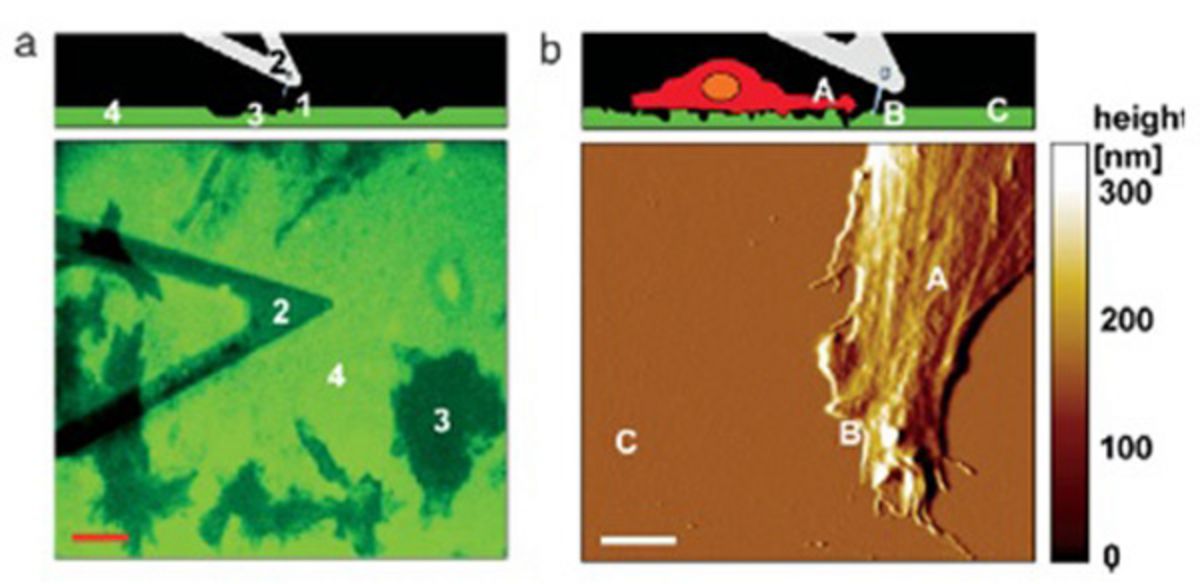
Figure 2: Morphometric quantitation of ECM degradation. a) the nanoscale topography of extracellular matix (ECM, green) as imaged via atomic force microscopy (AFM). A sketch (upper) demonstrates the imaging of a fluorescently labelled ECM (fluorescence image, lower). The degradation of the fluorescently labelled ECM is recognised as dark areas b) AFM-Imaging of a tumor cell on an a degradable extracellular Matrix (original image (lower panel) and schematic representation (upper). The total volume (AFM) of degraded ECM can be exactly calculated by nAnostic-Algorithms. Pictures taken from: Kusick et al. Jornal of Cellular Physiology 204: 767-774 (2005)